Currentcost
I had a Python client for a CurrentCost power meter, rewrote it in Rust and the Rust version is significantly quicker. This post covers some background and the Python version; the Rust version is in a future post.
Background
I’ve had a Currentcost CC128 — a thingamy 1 which clips around the live wire coming into your electricity meter and talks to a console to show how much power you’re using 2 in approximately real time — for a bit over eight years now3.
To get the power data out of it Currentcost sell a data cable which resembles, but isn’t quite, a console cable (apparently the voltages are different — I just bought the supported one). The cable has an RJ45 connector at one end (which goes into the CC console) and, through a serial-to-USB converter, a USB-A connector at the other. Plug it into a Linux machine, it’s detected as a CP210x 4 and you’re off to the races.
Every six seconds or so5 the console sends some XML down the wire in this sort of format (the XML is actually all squashed onto one line — for the sake of readability I’ve formatted it):
<?xml version="1.0"?>
<msg>
    <src>CC128-v1.29</src>
    <dsb>02371</dsb>
    <time>23:01:17</time>
    <tmpr>24.1</tmpr>
    <sensor>0</sensor>
    <id>04066</id>
    <type>1</type>
    <ch1>
        <watts>00803</watts>
    </ch1>
</msg>
This can clearly be parsed into something you can work with. The XML is fairly well documented but the fields pretty much speak for themselves. As the documentation suggests, the sample XML above isn’t all that’s sent6 but it’s all that matters for this.
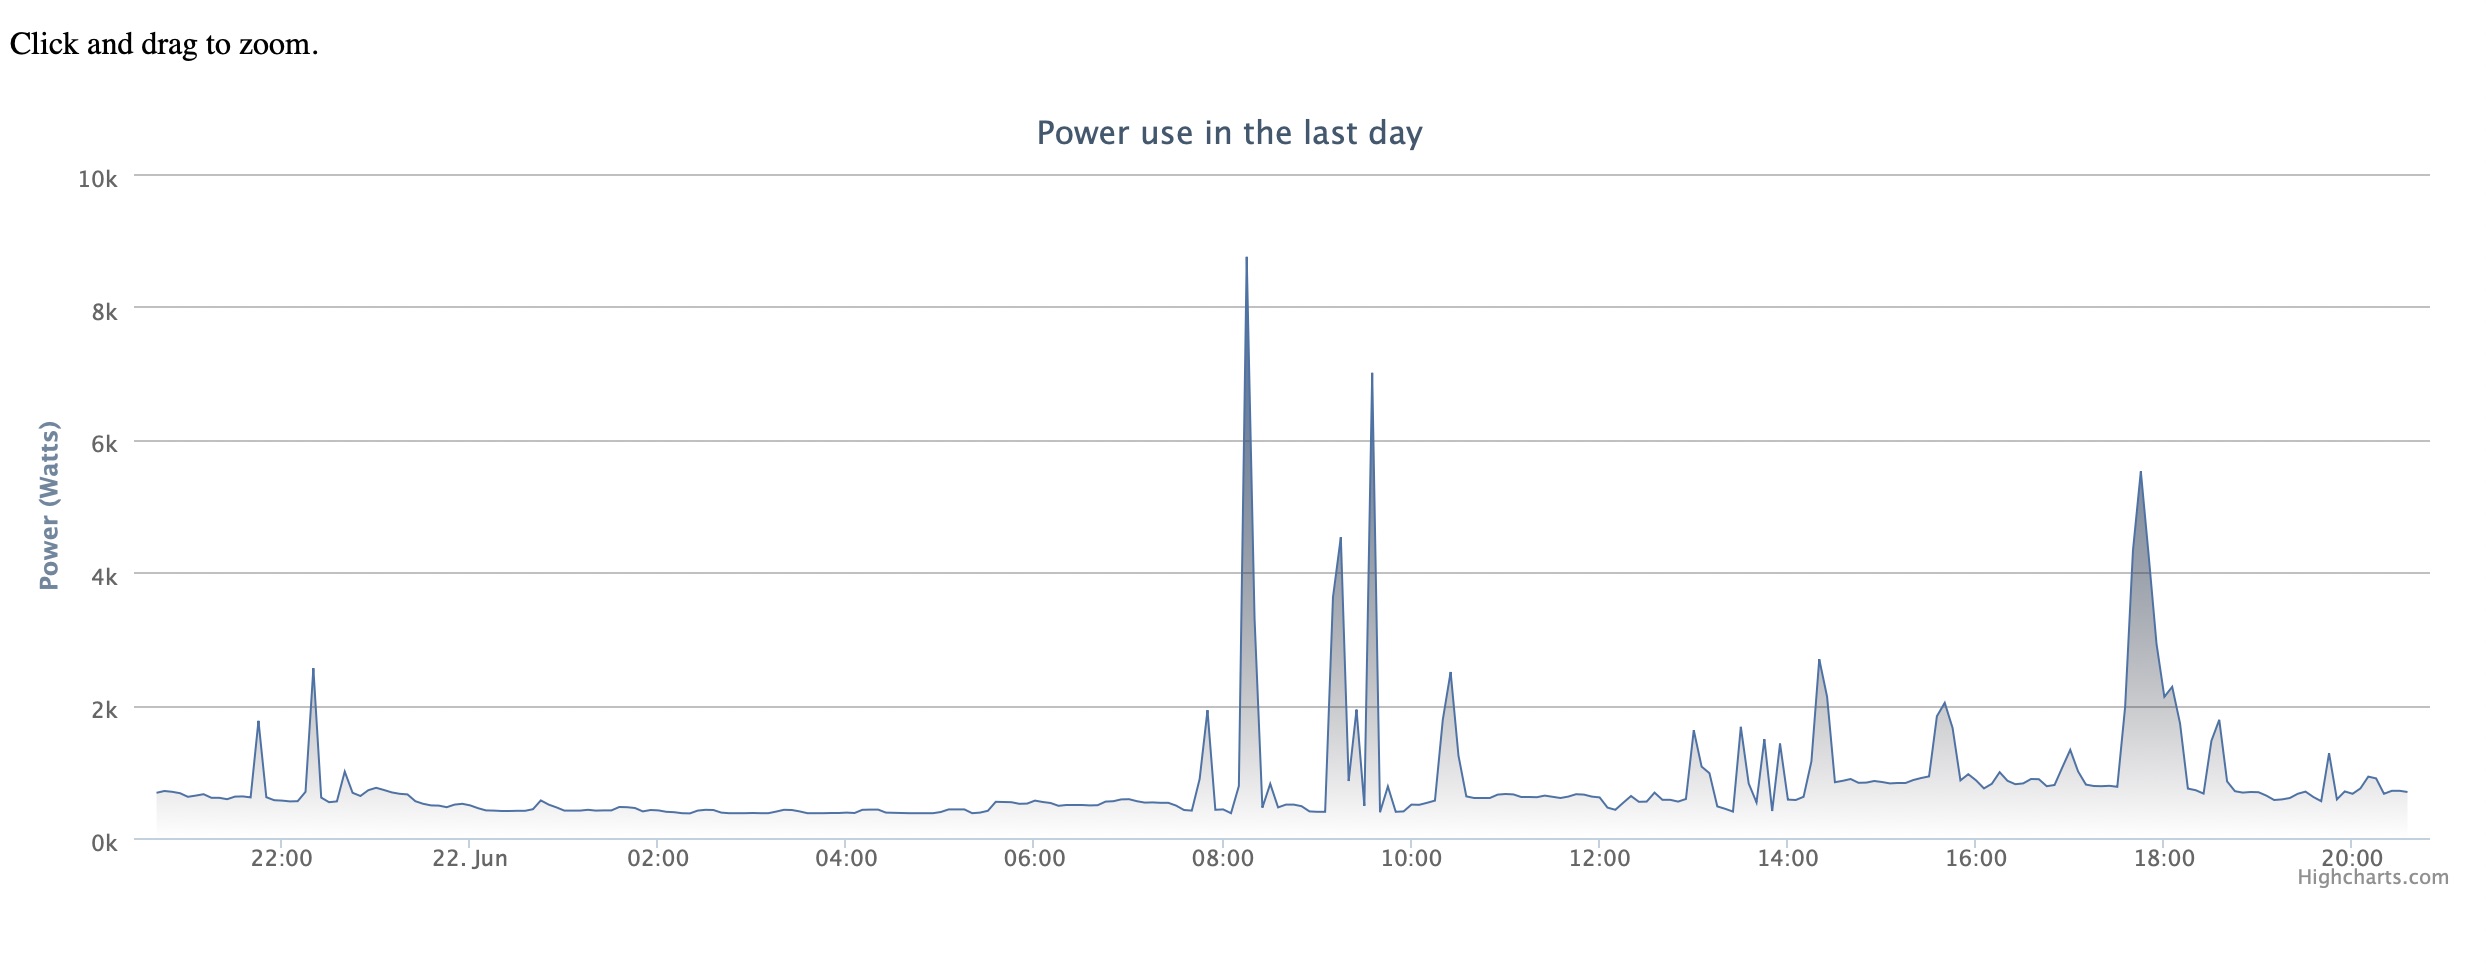
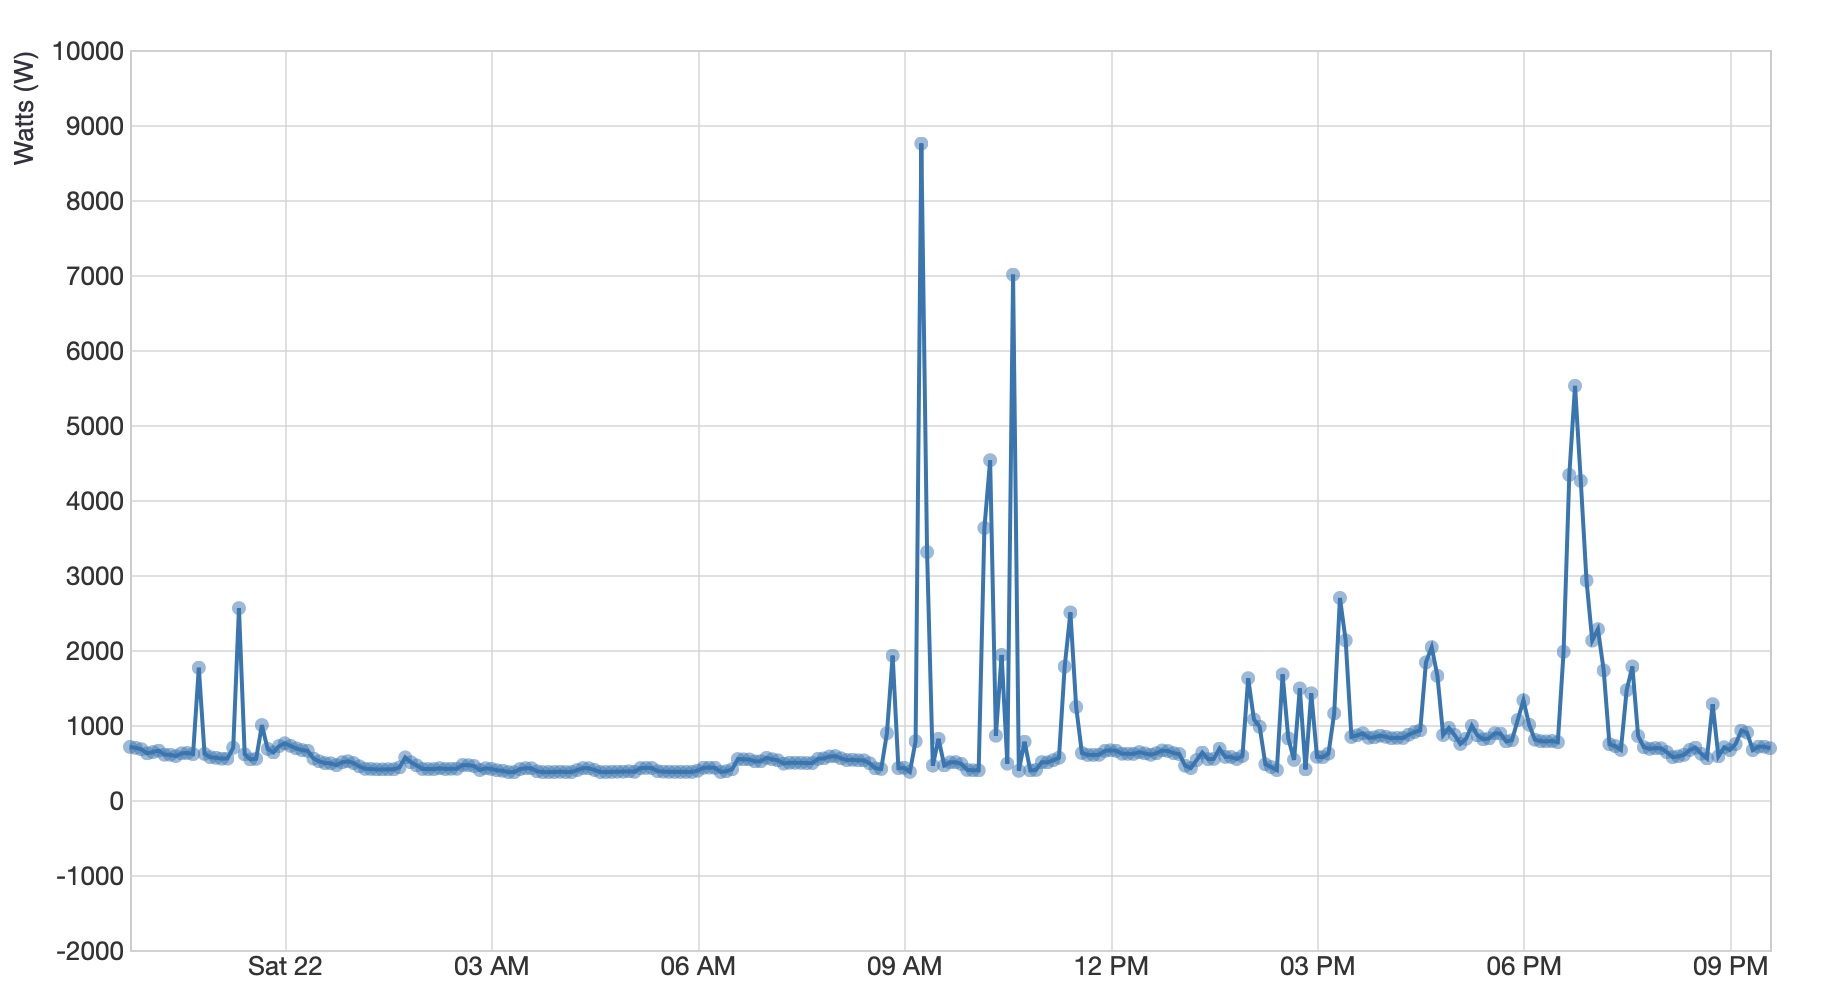
Getting the current power use, just like the console displays, is good but it’s more useful to store it and even more so to write it back out in some format to draw graphs with:
Python
With that background covered, the first version of this was written in Python and ran mostly unchanged until September 2019 (~7 years).
This is structured in three parts:
- a serial client which receives and parses the XML from the console then writes it to disk in CSV format
- something to read what’s been written out and store it somewhere, in this case a PostgreSQL database
- something to export the stored data in a useful format for charting
The main advantage of having three separate parts was that I could start logging data with only the first part finished, start loading the log into the database then finally export data out of the database to graph it; each part has less to do so should be less likely to crash or need a restart (the console doesn’t have any internal storage - anything that isn’t received is lost forever).
Serial client
The serial client loops around, storing what it gets in a buffer until it reaches a newline. It then parses what it gets as XML and writes the sensor ID, temperature and power to a log on disk in an attempt at a readable CSV format:
30/05/2019 22:50:27, 1559083827, Sensor 0, 24.100000°C, 803W
The first column is for my benefit if I’m tailing the log file; the epoch timestamp is used in parsing the file. Both are from the client machine rather than from the console, because I found it drifted too much. The communication between the console and the client machine is one-way so there’s no way to keep the console clock in sync.
If what came down the wire couldn’t be parsed as XML or couldn’t be parsed as the regular instantaneous power, it’s thrown away.
I mentioned before that the console doesn’t just send XML for the current power and temperature. It also sends a report at regular intervals, which looks like this:
<msg>
        <src>CC128-v1.29</src>
        <dsb>02414</dsb>
        <time>15:23:50</time>
        <hist>
                <dsw>02416</dsw>
                <type>1</type>
                <units>kwhr</units>
                <data>
                        <sensor>0</sensor>
                        <m004>597.250</m004>
                        <m003>681.250</m003>
                        <m002>613.250</m002>
                        <m001>599.750</m001>
                </data>
                <data>
                        <sensor>1</sensor>
                        <m004>4.750</m004>
                        <m003>2.250</m003>
                        <m002>2.000</m002>
                        <m001>2.000</m001>
                </data>
...snipped
        </hist>
</msg>
I don’t have anything useful to do with this report, so in the Python version I was ignoring it largely by accident (notice how there aren’t ‘tempr’ or ‘watts’ fields in the report XML).
Storage
A Python script turns each new line in the log into SQL INSERTs, and runs them into a Postgres database.
This works by iterating over the log, turning each row into a dictionary with parsed values for date/time, power and sensor ID (temperature isn’t stored) then piling all of these up in a list ready to be put into the database:
def process(line, last_seen):
    line = line.strip()
    tokens = line.split(',')
    if tokens:
        sensor = extract_number(tokens[2])
        unixtime = extract_number(tokens[1])
        power = extract_number(tokens[4])
        if int(unixtime) > last_seen:
            current_time = int(
                time.mktime(
                    datetime.datetime.today().timetuple()
                )
            )
            if int(unixtime) < current_time:
                rows_to_insert.append([unixtime, sensor, power])
                last_seen = int(unixtime)
    return last_seen
This can be run by cron as often as required, within reason (every 5 minutes, once an hour, daily — too often and you’re wasting CPU time to have nothing to insert, not often enough and you’re not getting recent data to chart).
Performance is covered later in the context of the improvement from using Rust but a change to the first script (the serial listener) which resulted from this one was implementing log rotation — for a log file around six months old (with a little over 5 million lines), the Python version will take about 12 seconds to scan through it.
Export
The final step is exporting from the database, generating JSON that can be plotted — I’ve used Highcharts and d3.js for that.
This is done with a cron job and spits out JSON with a point every five minutes (i.e. three hundred thousand milliseconds) which looks like this:
{
  "power": [
    {
      "data": [
        [
          1590318000000,
          875
        ],
        [
          1590318300000,
          858
        ],
...snipped
      ],
      "period": "1 day"
    }
  ],
  "unit": {
    "full_name": "Watts",
    "symbol": "W"
  }
}
There’s another post in itself exploring my adventures in chart libraries.
-
it’s a current transformer — the alternating current in the live wire induces a magnetic field around it which varies with the size of the current; if you can measure the magnitude of the magnetic field, you can work out what the magnitude of the current was and from there what power was being used. ↩
-
give or take power factor ↩
-
found the Amazon shipping notification email: 8th of December 2011) ↩
-
a fairly common class of serial-to-USB convertor — I have one for a weather station console too, which complicates making sure I’m talking to the right one… ↩
-
a good way to tell if the batteries in the transmitter are dying is that the gap between transmissions gets longer and longer ↩
-
I actually forgot that it wasn’t just the instantaneous power — more on that later ↩